
Decoding Market Breadth: How To Use It To Forecast Stock Market Movements
Investors and traders pay close attention to different indicators to assess the Market Breadth. One important but frequently ignored metric is Market Breadth. This indicator offers valuable insights into the underlying strength of market movements, aiding investors in making well-informed choices. In this blog, we will delve into the concept of market breadth, its importance, the various indicators used to measure it, and how it can assist you in improving your investment decisions.
What is Market Breadth?
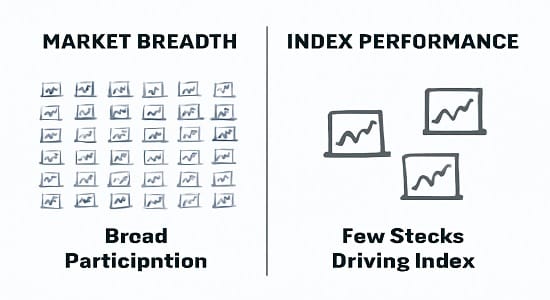
Market breadth indicates the level of participation among stocks during a market movement. It evaluates whether a wide range of stocks is moving in the same direction as the market index or if the movement is primarily influenced by a handful of large-cap stocks.
Market Breadth: Why It’s Crucial for Smart Investing
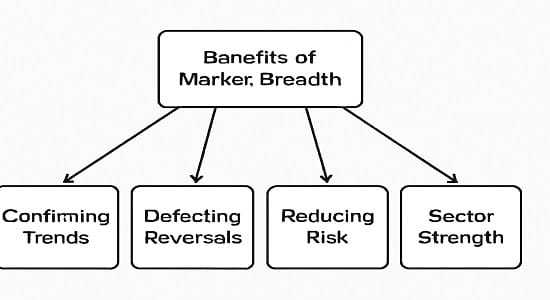
Market breadth is essential because it helps investors understand whether market trends are broad-based or concentrated. Here are a few reasons why it matters:
- Confirms Market Trends: If an index is rising while most stocks are declining, it may suggest a weak rally, signaling investors to proceed with caution.
- Detects Market Reversals: A discrepancy between the index and market breadth frequently indicates a potential reversal on the horizon.
- Reduces Risk in Decision-Making: Investors can evaluate the sustainability of a rally or sell-off before deciding to buy or sell.
- Identifies Sectoral Strength: Breadth indicators assist in identifying which sectors are thriving within a larger market trend.
Market Breadth Indicators: A Comprehensive Guide For Traders & Investors
Several indicators help measure market breadth. Here are some of the most commonly used ones:
Advance-Decline (A/D) Line:
- The Advance-Decline (A/D) Line assesses the ratio of stocks that are advancing (increasing in value) compared to those that are declining (decreasing in value).
- If the A/D line moves in the same direction as the index, it serves as confirmation of the trend.
- If the index goes up while the A/D line declines, it indicates weak market participation, which could signal potential weakness in the future.
Advance-Decline Ratio:
- This ratio measures the number of stocks that are advancing compared to those that are declining. A ratio greater than 1 indicates bullish momentum, whereas a ratio less than 1 points to bearish sentiment.
McClellan Oscillator:
- This indicator is based on momentum and assesses the difference between short-term and long-term averages of stocks that are advancing or declining. It is useful for spotting overbought and oversold market conditions.
New Highs vs. New Lows:
- Monitoring the number of stocks reaching 52-week highs compared to those hitting 52-week lows provides valuable insight into the market’s overall health. An increase in stocks hitting new highs indicates a robust bull market, while a rise in new lows points to market weakness.
Percentage of Stocks Above Moving Averages:
- This indicator shows the percentage of stocks that are trading above their 50-day or 200-day moving averages. A higher percentage typically indicates a strong upward trend, whereas a lower percentage points to potential market weakness.
Using Market Breadth for Investment Decisions: A Practical Guide
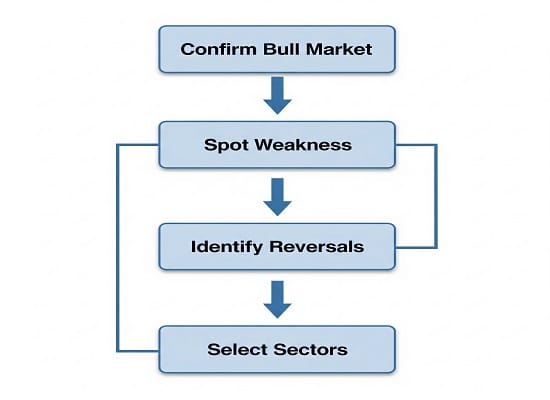
- Confirming a Bull Market: When the stock market index increases and market breadth indicators, such as the A/D line, also show an upward trend, it signals a robust bull market. This gives investors the confidence to take long positions and maintain their stock holdings for the long term.
- Spotting Market Weakness Early: If the index keeps climbing while market breadth indicators begin to fall, it suggests that a smaller number of stocks are driving the rally. This can often serve as a warning sign for a potential market correction, prompting investors to exercise caution.
- Identifying Trend Reversals: A market uptrend accompanied by weak breadth may indicate a potential reversal on the horizon. On the other hand, if the market is experiencing a downtrend but breadth indicators begin to show improvement, this could serve as an early sign of a bullish reversal.
- Selecting Strong Sectors: Investors can utilize breadth indicators to pinpoint the sectors that are influencing the market trend. When breadth is robust in a specific sector, it suggests more favorable investment opportunities within that area.
Market Breadth Indicators: How To Use Them In Indian Stock Market Investing
In India, market breadth is widely used by analysts to track the NSE Nifty and BSE Sensex trends.
- If the Nifty 50 is on the rise but the Advance-Decline ratio is negative, it indicates that the rally is being fueled by just a handful of large-cap stocks, while the overall market remains weak.
- The percentage of stocks above their 200-day moving average on the NSE can provide insights into the overall market strength.
A strong market should have widespread participation, not just a few leading stocks.
Here to explore discussions, exchange ideas, and learn something new along the way.
I enjoy learning from different perspectives and adding to the conversation when possible. Always open to new ideas and building connections.
There is my site:AutoMisto24
https://automisto24.com.ua/
LMC Middle School https://lmc896.org in Lower Manhattan provides a rigorous, student-centered education in a caring and inclusive atmosphere. Emphasis on critical thinking, collaboration, and community engagement.
Boosting Brians club credit drives investor trust.
Building Brians club credit helps prepare for future expansion.
Strong Brians club credit is key for scaling ventures.
Establishing jokerstash.at credit secures lasting business stability.
Establishing briansclub.llc credit increases leverage.
By improving Briansclub credit, businesses gain financial independence.
Good day very nice blog!! Guy .. Beautiful .. Superb .. I’ll bookmark your web
site and take the feeds additionally? I am glad to find a lot of
helpful information here within the post, we want develop
extra strategies on this regard, thank you for sharing.
. . . . . https://Bet20aus.wordpress.com/
It’s funny how playing at an digital gaming platform can teach you about patience and discipline. At first, I used to deposit impulsively, hoping for quick wins. Now, I treat it more like a hobby — I plan my bankroll, focus on favorites, and stick to them. Once you stop thinking of it as a way to get rich and more as relaxation, the whole play session becomes much more balanced.
seoorbit.click – Bookmarked this immediately, planning to revisit for updates and inspiration.
Pages loaded fast, images appeared sharp, and formatting stayed consistent.
Bookmarked this immediately, planning to revisit for updates and inspiration.
Found practical insights today; sharing this article with colleagues later.
Pages loaded fast, images appeared sharp, and formatting stayed consistent.
Navigation felt smooth, found everything quickly without any confusing steps.
Appreciate the typography choices; comfortable spacing improved my reading experience.
Navigation felt smooth, found everything quickly without any confusing steps.
Loved the layout today; clean, simple, and genuinely user-friendly overall.
Color palette felt calming, nothing distracting, just focused, thoughtful design.
Navigation felt smooth, found everything quickly without any confusing steps.
Content reads clearly, helpful examples made concepts easy to grasp.
Overall, professional vibe here; trustworthy, polished, and pleasantly minimal throughout.